A General Counsel who walks into a board meeting with a forty-slide pack of activity data has usually already lost the room. Directors and CFOs are not looking for a record of how busy the legal team has been. They want to know what legal costs, how that compares with peers, how quickly the business gets answers and where the organisation is exposed. The metrics that answer those questions fit on a single page, and the discipline lies in choosing them and defining them consistently.
This guide sets out the legal department KPIs worth reporting to the board and the CFO, how to calculate each one, how often to report them and which common metrics belong in an operational report rather than a board pack.
Why Legal KPIs Need a Different Standard
Legal departments are cost centres, and a CFO’s first question is almost always how much the function costs and how that compares with similar organisations. A metric earns its place in a board report only if it informs a decision, such as whether to renegotiate rates, invest in technology, change the balance between in-house and outside work or take on an unusual risk.
Activity metrics, such as the number of hours billed or the number of documents reviewed, rarely meet that test. They describe effort and not value. If a team closes a matter in five hours instead of twenty, that is an improvement, yet an hours-based report would show it as a decline in activity. Reports should focus on turnaround time and throughput, not hours.
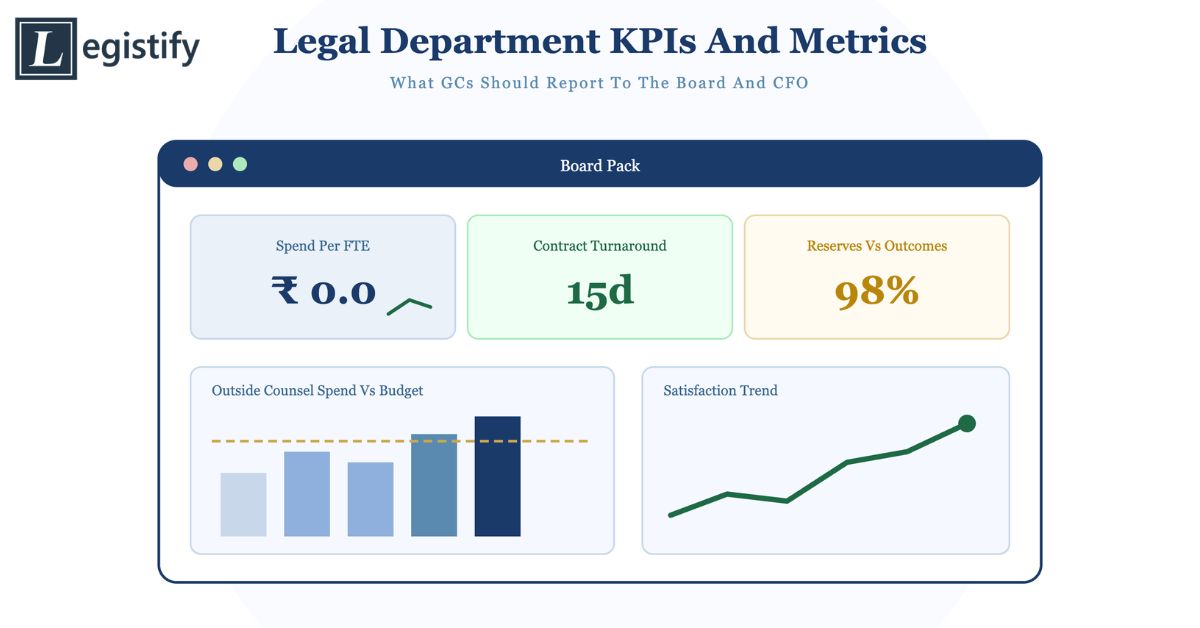
The Six KPIs Worth a Board Slide
1. Outside counsel spend per company FTE
Formula: total outside counsel spend divided by total company headcount.
The denominator is the headcount of the whole company and not of the legal team, because the question being answered is what legal costs the business per employee. This is the metric most comparable across organisations, and it gives the CFO an immediate reference point against peers in the same industry and size band.
2. Outside counsel spend as a percentage of revenue
Formula: total outside counsel spend divided by total revenue.
This normalises spend against the size of the business. It lets the board see whether legal cost is growing faster or slower than the company, and it holds up when revenue changes materially from one year to the next. The ACC Law Department Management Benchmarking Report, 2024 edition, found that the median legal department spends 48% of its total budget on outside counsel, and that outside firms receive 87% of the external legal budget, with the rest going to alternative providers and other vendors. These figures give context for where an organisation sits.
3. Average contract turnaround time
Formula: the average number of days from contract request to signature, reported by contract type.
This is the clearest measure of how well legal supports the business. Report it separately for routine agreements such as NDAs and for complex agreements, because a single blended average hides both fast routine work and slow strategic work. The board report should show the trend, not just the current figure.
4. Self-serve resolution rate
Formula: the share of business requests resolved without a lawyer’s direct involvement, for example through templates, playbooks or automated workflows.
A rising rate shows that legal’s knowledge is being scaled through systems, not through headcount. It is also a useful link between the legal function’s efficiency programme and its cost position.
5. Litigation reserves versus outcomes
Formula: the amount reserved for disputed matters compared with the actual settlement or judgement amount once matters conclude.
This tells the board and finance whether legal’s estimates of exposure are reliable. Consistent over-reserving ties up capital, while under-reserving creates unwelcome surprises in the accounts. For Indian enterprises with a large litigation portfolio, this metric should also show contingent liability by forum, such as civil courts, tribunals and tax appellate authorities.
6. Cross-functional satisfaction
Formula: a net promoter score or a short satisfaction rating from the internal clients legal serves, collected on a regular cycle.
Speed and cost do not capture whether the business finds legal useful. A short survey completed by the people who rely on legal gives the board a view of service quality that financial metrics cannot supply.
Supporting Metrics That Belong in the Operational Report
Many useful measures belong in a longer operational report for the General Counsel’s own use and should not appear in the board pack. They include e-billing rejection rate, which indicates how seriously the department enforces its own billing guidelines, rate compliance across the law firm panel, invoice accuracy, panel utilisation and the proportion of fixed-fee or alternative-fee arrangements. Process adoption measures such as the CLM adoption rate and playbook reuse also belong here. They explain why the headline KPIs are moving, but they are not the headline themselves.
Who Gets Which Metrics, and How Often
| Audience |
Metrics |
Cadence |
| Board |
Spend per FTE and as a percentage of revenue, contract turnaround, litigation reserves versus outcomes |
Quarterly |
| CFO |
Budget versus actual, spend by firm and matter type, spend per FTE |
Monthly |
| General Counsel |
Full operational set, including billing compliance and adoption |
Monthly |
| Business leaders |
Turnaround, self-serve rate, satisfaction |
Quarterly |
Spend and budget-versus-actual figures are normally shared monthly with the General Counsel and the CFO. Cycle time and adoption metrics are usually reviewed monthly or quarterly and reported to the board.
What a Good Board Statement Sounds Like
The test of a well-chosen set of metrics is whether the General Counsel can summarise legal’s position in a few sentences. For example: “We handled more matters this quarter than last. Our average turnaround for routine agreements held steady at fifteen days. Outside counsel spend is at 85% of annual budget with three months remaining, and our reserves for open litigation are in line with outcomes on matters closed this year.” That statement covers volume, speed, cost and exposure, which are the four things a board needs to hear.
Common Mistakes in Legal KPI Reporting
Reporting too many metrics. A dashboard that grows every time a new function is added, such as privacy, compliance or ethics, soon measures activity instead of value. Prune it regularly, and keep three to six headline measures.
Using inconsistent definitions. If spend per FTE uses legal headcount one quarter and company headcount the next, the trend is meaningless. Fix each definition in writing and apply it consistently.
Reporting without baselines or peer context. A figure only becomes meaningful when it is compared with a prior period, a budget or a benchmark.
Measuring what is easy and not what matters. Counting documents reviewed is easy. Measuring whether the business received answers fast enough is harder, and it is the more relevant measure.
Failing to connect legal metrics to business outcomes. Turnaround time tells the board whether legal is faster. Spend tells it whether legal is cheaper. The report should state both, and say what they mean for revenue, risk or cost.
The Data Foundation Behind the Dashboard
Good KPIs depend on data that is complete and consistent. Contract turnaround needs request and signature dates captured automatically in a contract system. Spend metrics need matter-level billing data from e-billing or matter management. Litigation reserves need case records linked to financial estimates. A unified dashboard that draws from these systems, and not from manually assembled spreadsheets, is what allows the General Counsel to present figures with confidence and answer follow-up questions in the meeting.
There is also a link to value leakage after contracts are signed. WorldCC research puts the average erosion of contract value at almost 9%, and separate work on post-signature performance points to a higher figure, so a legal department that reports on obligation tracking and renewal management is giving the board information about money, not only about process.
Legistify’s platform brings contract, litigation and notice data into a single record, with dashboards that report turnaround time, case exposure and external counsel spend by matter. This allows Indian enterprise legal teams to produce board and CFO reports from live data, and to show how contingent liability and spend are moving across courts, tribunals and business units.
Conclusion
The best legal department reports are short. They give the board a small number of consistently defined measures covering cost, speed, exposure and service quality, and they place each figure in context against a budget, a prior period or a peer benchmark. The remaining operational detail still matters to the General Counsel, but it supports the headline numbers and does not replace them. A department that builds its data foundation first and chooses its KPIs carefully will find that board and CFO conversations focus on decisions and not on justifying activity.